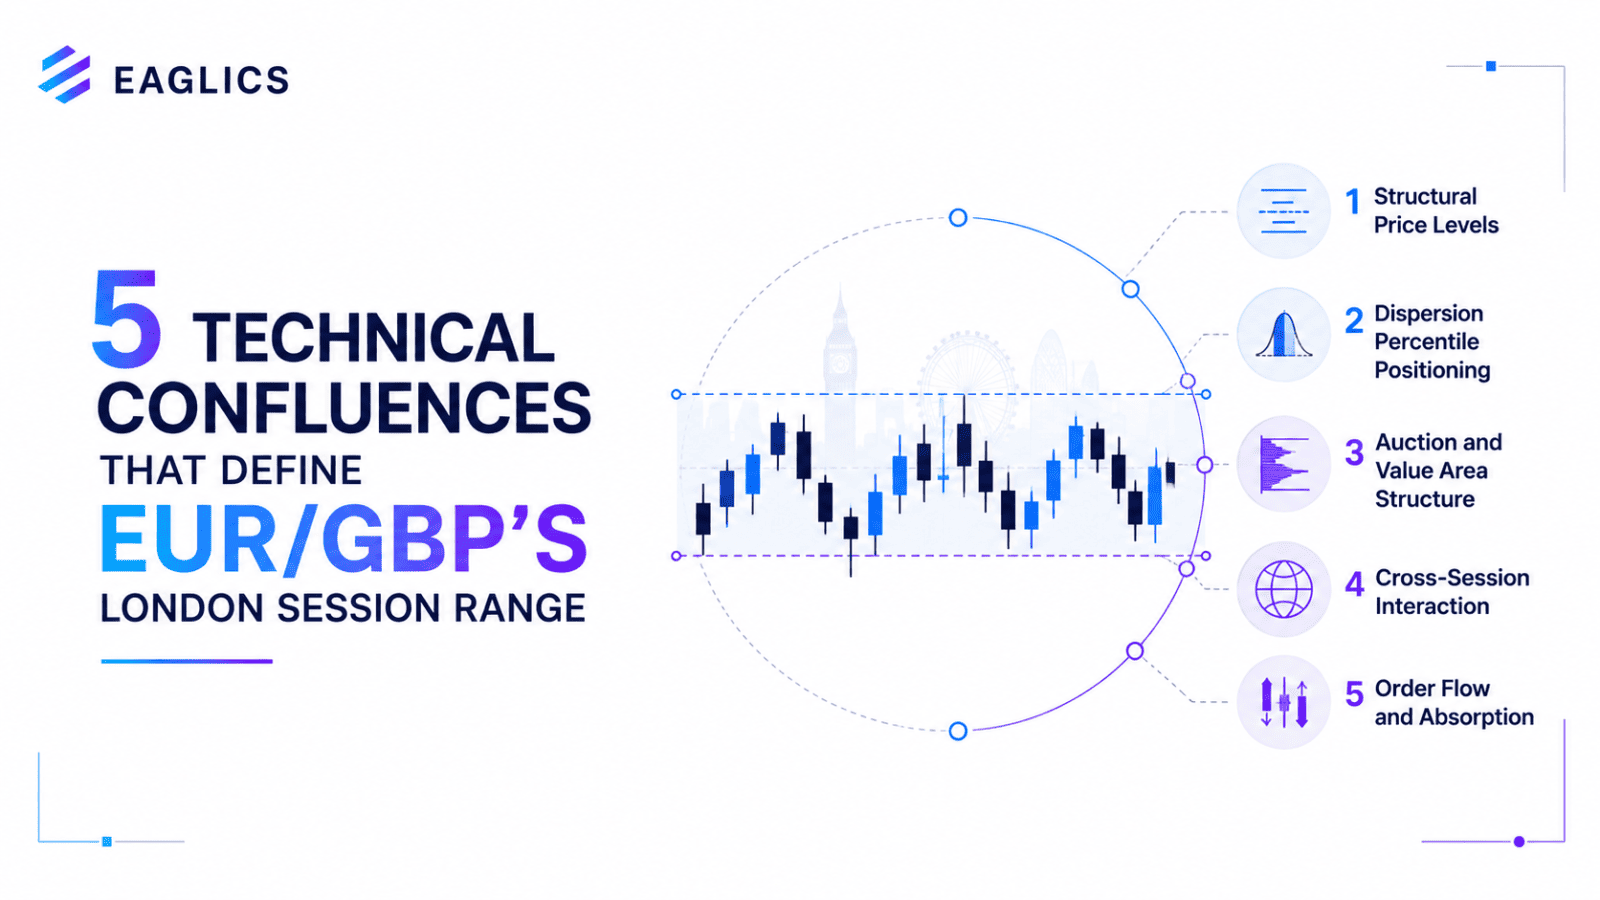
EUR/GBP technical analysis operates inside a constraint that eliminates most of the standard analytical toolkit. The pair's daily range averages 40 to 70 pips. It exhibits long-memory mean reversion across most market conditions, its fractal memory regime classifies it as mean-reverting rather than trend-persistent for the majority of its trading history. Its directional phases are short, policy-driven, and structurally bounded by the depth of the ECB-BoE rate spread. The analytical tools built for trend-persistent instruments, those calibrated for wider-ranging pairs with sustained directional memory, produce systematic false signals on EUR/GBP. What works on this pair is what was designed for its specific character: structural price levels, dispersion percentile positioning, auction and value area structure, cross-session interaction, and order flow absorption.
The EUR/GBP Complete Structural Guide covers the pair's foundational mechanics in full. This article covers the five technical confluences that determine where the London session's range boundary is most likely to form, and where the Eaglics pre-session forecast zone sits within that framework.
EUR/GBP as a Technical Instrument: Built for Range, Resistant to Trend
EUR/GBP is analytically tractable precisely because it does not trend persistently. Extended directional phases require a sustained and widening ECB-BoE 2-year rate spread, a condition present in specific windows of each central bank cycle and then resolved. Outside those windows, the pair's long memory regime classifies it as mean-reverting: it oscillates inside 100 to 200 pip consolidation bands, and the same structural levels are tested repeatedly across weeks and months.
This gives the technical framework exceptional durability. A structural level established three months ago remains analytically relevant in a way that is unusual on EUR/USD or GBP/JPY, where trend-persistent directional memory resets levels more frequently. The practical consequence is that EUR/GBP technical analysis is less about identifying momentum continuation and more about identifying the precise structural zones where range boundaries form.
What the technical framework alone cannot do is quantify the session's probable range width before the London open from the factor inputs that determine it each session, dispersion percentile, ECB-BoE rate differential trajectory, cross-flow factor from EUR/USD and GBP/USD, event calendar proximity. That is what the Eaglics pre-session forecasted zone adds: a model-derived high and low before either price level has appeared on the chart.
5 Technical Confluences EUR/GBP Participants Watch Every Session
1. Structural Price Levels: Their Longevity and Institutional Origin
Structural price levels on EUR/GBP have exceptional longevity compared to trend-persistent instruments. A level that produces a documented institutional reaction on the daily chart, a decisive reversal on elevated realized volatility, a double test with absorption, an extended consolidation boundary, retains structural relevance for weeks to months. The mechanism is the pair's mean-reverting long memory regime: institutional order flow that defined a level the first time remains positioned around it when price returns, because the same economic architecture that produced the original mean-reversion impulse is likely still in place.
The depth of UK-EU trade and capital integration creates a structural dampening mechanism. When EUR/GBP deviates from its equilibrium level, cross-border flows reassert it. As price approaches the zone where that equilibrium was previously asserted, the order flow dynamics that built the level tend to reconstitute, which is why auction and value area analysis on this pair produces durable signals rather than transient ones.
In the current 2026 structural context, three levels carry specific institutional significance. The 0.8500 zone has functioned as a structural floor across multiple tests in 2025 and 2026, a round-number level with documented option expiry concentration and interbank reference significance. The 0.8600 zone has acted as an intermediate consolidation ceiling across the pair's 2026 range-bound period. The 0.8700 to 0.8800 zone marks the upper structural boundary of the current range, established during the ECB-BoE divergence move that produced the March 2026 high of 0.877, according to published EUR/GBP exchange rate data for 2026.
None of these levels are fixed. They migrate as the ECB-BoE rate spread evolves and as institutional positioning rotates. But their persistence across the current policy cycle makes them the primary reference framework for pre-session range planning on both the daily and H4 timeframes.
2. Dispersion Percentile Positioning: The Regime That Changes Every Other Input
Dispersion percentile positioning locates the current session's realized volatility within EUR/GBP's own trailing distribution. It is the first input in any pre-session technical framework for this pair, not because it predicts the session's direction, but because it determines which analytical regime the session belongs to, and therefore what every other structural input means.
The Eaglics volatility regime runs four states. A quiet regime, dispersion in the low percentile of the trailing distribution, corresponds to compressed conditions and a tightened forecasted interval. A normal regime sits at mid-percentile dispersion with the baseline interval. An expansion regime reflects elevated percentile dispersion, typically coinciding with ECB or Bank of England event proximity, and widens the forecasted interval. An extreme regime, tail percentile dispersion, reflects shock conditions and maximally widens the interval.
Each of these states changes how structural price levels behave. In a quiet regime, structural levels function as reliable range boundaries, the session resolves inside them with high probability. In an expansion or extreme regime, the same levels become directional reference points: the session can extend through them on event-driven order flow, and their function shifts from boundary to pivot. The Eaglics volatility regime tag, published with every pre-session EUR/GBP forecast as a low, normal, or elevated classification, is the practical expression of this four-state framework in live output.
Extended periods in low-percentile dispersion are not stability signals on EUR/GBP. They are compression signals. EUR/GBP's realized volatility history from 2003 to present shows that extended quiet regime periods are reliably followed by expansion events associated with identifiable structural triggers: ECB or Bank of England policy surprises, UK fiscal credibility events, or a material shift in the ECB-BoE rate spread. Knowing the current dispersion percentile before the London open is knowing whether the structural levels are acting as boundaries or as range-extension pivots.
3. Auction and Value Area Structure: Where Liquidity Actually Concentrated
Auction and value area structure identifies where liquidity actually concentrated over a trailing window, not where price moved to, but where it spent time. On EUR/GBP, the auction and value area framework produces the most durable intraday structural reference because the pair's mean-reverting character means that the zones where price has spent the most time at equilibrium are the zones it repeatedly returns to.
The value area on EUR/GBP's daily profile defines the zone that contains the majority of the session's traded time. A price level at the edge of the value area, the value area high or value area low, represents a structural boundary where the auction has historically been rejected. When the current session's pre-session forecasted high or low aligns with the value area boundary from the prior session or the prior week's composite, the convergence of two independently derived structural signals elevates the probability that the current session's range forms at that zone.
This framework is particularly relevant for EUR/GBP's Monday structure. The prior week's composite value area defines the equilibrium zone for the new week's opening auction. When EUR/GBP opens inside last week's value area, the structural expectation is a mean-reverting session that tests but does not extend beyond the value area boundaries. When it opens outside, the structural expectation shifts, the value area boundary becomes the first significant re-entry reference as institutional desks position for the week.
4. Cross-Session Interaction: How the Asian Range Conditions the London Open
Cross-session interaction measures conditional range and breakout probabilities across overlapping global trading sessions. On EUR/GBP, the Asian session's range has a direct conditioning effect on the London session's probable high and low, not because the Asian session drives EUR/GBP meaningfully, but because the boundaries of the Asian consolidation define the initial reference framework for London's opening order flow.
The Asian session contributes 5 to 10 percent of EUR/GBP's daily range. Neither the Euro nor the Pound is a primary Asian session currency. Price drifts in this window without institutional depth, establishing a narrow consolidation band, typically 10 to 20 pips in a quiet regime, that represents the market's equilibrium state before European order flow begins.
The structural significance of the Asian range for London session planning is this: the boundaries of the Asian range are the first levels London's institutional order flow encounters. When EUR/GBP opens the London session at the top of the Asian range, the structural expectation from cross-session interaction analysis is a test of whether London order flow extends the move, confirming the Asian high as support, or reverses it, treating the Asian high as a distribution point for the first institutional selling of the European session.
The Eaglics model incorporates cross-session interaction as a live input in each daily forecast through the cross-session interaction domain of its factor library, one of the seven factor domains constructed before regime conditioning. The conditioning effect of the Asian session's range on the London session's probable boundary is a structural input, not an observational heuristic.
5. Order Flow and Absorption: The Mechanism Behind Every Level That Holds
Order flow and absorption is the mechanism behind every structural price level that actually holds on EUR/GBP. When a level produces a documented reversal, when price approaches a zone and decisively rejects, the mechanism is not chart geometry. It is order flow absorption: the concentration of institutional limit orders at that zone absorbing aggressive market orders in the opposite direction until the aggressive flow is exhausted.
The Eaglics model incorporates volume-weighted pressure measures, a market efficiency ratio, and absorption intensity at price extremes as a domain within its 108-factor orthogonalized library. These inputs capture the same institutional dynamics that produce the structural levels described in Confluence 1, but from a flow perspective rather than a price-level perspective. When both converge, a documented structural price level aligns with evidence of historical order flow absorption at that zone, the confluence is the highest-confidence structural signal available for pre-session range boundary identification.
On EUR/GBP specifically, order flow absorption events at structural levels carry persistence across sessions because of the pair's mean-reverting long memory regime. An institutional desk that absorbed aggressive selling at 0.8500 in one session and profited from the subsequent mean-reversion is likely to defend the same level in subsequent sessions, building the level's structural significance through repeated order flow reinforcement. This persistence is what distinguishes EUR/GBP's structural levels from those on trend-persistent pairs, where absorption at a level frequently fails to produce a second reversal.
How the Pre-Session Forecasted Zone Fits Within the Technical Framework
Using the Forecasted High and Low as Structural Anchors
The EUR/GBP Daily Range Forecast and the five-confluence technical framework operate on different informational inputs, and that is precisely why they are complementary rather than redundant. The technical framework reads from price history and market structure: structural levels, dispersion percentile, auction and value area boundaries, cross-session interaction conditioning, order flow absorption zones. The Eaglics model reads from the session's driving factors: the orthogonalized factor library, dispersion percentile conditioning, cross-flow factor from EUR/USD and GBP/USD, ECB-BoE rate spread trajectory, event calendar proximity.
When the pre-session forecasted high aligns with a documented order flow absorption zone at a structural level, and the current dispersion percentile sits in quiet or normal regime, the convergence of three independently derived signals produces the highest-confidence pre-session framework available for this pair. The confidence score in the daily output quantifies the model's certainty for that session's conditions. When the confidence score is elevated and the forecasted boundary coincides with a structural confluence, the probability that the session's range forms at that zone is substantially higher than when either signal appears in isolation.
The pre-session checklist is systematic. Where does the forecasted high sit relative to the value area boundary from the prior session? Does the current volatility regime tag, low, normal, or elevated, support a session that reaches the forecasted boundary without extension? Is the 07:00 to 10:00 GMT window the window where order flow absorption at that level is most likely to occur? Does the Asian range conditioning suggest London opens inside or outside the prior value area? Each alignment increases analytical confidence; each divergence signals a session with higher structural uncertainty.
When the Forecasted Zone and the Structural Framework Diverge
Divergence between the Eaglics forecasted zone and the structural technical framework is informative. When the forecasted high sits significantly below a documented structural level with established order flow absorption history, the divergence signals one of two conditions. Either the session resolves inside the forecasted zone, the more common outcome in a quiet dispersion regime, and the structural level is not tested. Or an expansion event driven by unforecast order flow pushes the session to the structural level, breaching the model's standard accuracy band for that regime.
The correct response is not to override either signal. It is to recognise that the session carries higher structural uncertainty and to adjust the execution framework accordingly, treating the forecasted boundary as the first reference and the structural level as the extended reference, with position sizing calibrated to cover both scenarios within the session's daily drawdown parameters.
EUR/GBP H4 vs Daily Chart: Timeframe Function in the Pre-Session Framework
The daily chart is the structural reference for EUR/GBP. It provides the view of established structural levels, the composite value area across the prior week, the dispersion percentile in the context of recent realized volatility, and the ECB-BoE rate spread's directional expression in price over recent sessions. Every daily-chart structural signal carries more weight than an equivalent H4 signal because it represents a larger pool of institutional order flow across a longer time window.
The H4 chart is the session execution reference. It provides the granularity to track the developing auction structure within the London session, where price is spending time, where absorption is occurring at the session's edges, how the cross-session interaction conditioning from the Asian range is being resolved in London's early institutional order flow. The H4 chart reveals the intraday value area as it develops, where price has spent the most time, and whether the current session is building value inside or outside the prior day's value area.
The hierarchy is clear: daily chart for structural planning, H4 chart for session execution. When both timeframes agree, when the daily chart's structural level coincides with the developing H4 value area boundary, and the Eaglics forecasted zone aligns with both, the confluence across three independently derived frameworks is the highest-confidence pre-session setup this pair offers.
For participants using the EUR/GBP systematic trading approach, this H4 and daily framework provides the structural context within which the pre-session model output operates. For those applying the EUR/GBP prop firm trading execution framework, the structural levels and value area boundaries define the planning perimeter within which the forecasted zone is evaluated before any position decision is made. The full pipeline behind the Eaglics model output is documented in the Eaglics Research Framework.
Frequently Asked Questions
What Is the Most Reliable Structural Framework for EUR/GBP Analysis?
Structural price levels combined with dispersion percentile positioning produce the most reliable pre-session framework for EUR/GBP. Because the pair's long memory regime classifies it as mean-reverting, level-based and regime-based analysis consistently outperforms frameworks calibrated for trend-persistent instruments.
Why Do Momentum-based Frameworks Underperform on EUR/GBP?
EUR/GBP's fractal memory regime is mean-reverting for the majority of its trading history. Frameworks designed for trend-persistent instruments generate systematic false signals on a pair whose directional phases are short, policy-driven, and bounded by the ECB-BoE rate spread.
What is Dispersion Percentile Positioning in EUR/GBP Analysis?
Dispersion percentile positioning locates current realized volatility within EUR/GBP's own trailing distribution. It classifies the session's volatility regime, quiet, normal, expansion, or extreme, which determines whether structural levels function as reliable range boundaries or as directional pivots for the London session.
When Does EUR/GBP's London Session Range Form?
EUR/GBP concentrates 70 to 80 percent of its daily range inside the London session from 07:00 to 16:00 GMT, with the 07:00 to 10:00 GMT window carrying the heaviest institutional order flow. The UK accounts for 37.8% of global FX turnover according to the BIS 2025 Triennial Survey, the single largest concentration globally.
Does Eaglics Publish a Volatility Regime Classification Alongside its EUR/GBP forecast?
Yes. Each Eaglics EUR/GBP pre-session forecast includes a volatility regime tag, low, normal, or elevated, alongside the forecasted high and low and a confidence score. The regime tag is calibrated specifically to EUR/GBP's dispersion percentile distribution.

Comments 0
Leave a comment anonymously, or add your email. Your email is never displayed.